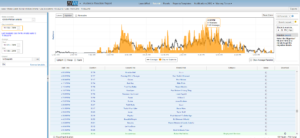
With Audience Reaction® you can analyze data from Nielsen Audio.
 From the Media Monitors web site, you can retrieve what was played on the air shown in our traditional log format. You can play back the audio of what was broadcast. See a graph of the behavior of the listeners in the PPM panel who were tuned into your station. This helps you instantly spot peaks and dips in ratings. In addition, you can filter the PPM data to see in-home and out-of-home listening levels.
The Audience Reaction® tool is available on a license basis for Media Monitors and PPM clients in select markets. With Media Monitors’ Audience Migration®, you can view four important aspects on a minute to minute basis:
- Tune-in
- Tune-out
- Tune to another station Tune-out
- Tune from another station
See content and ads that were played on a station for a selected time range and match them with Audience Migration®. Play back programming from the station and correlate it with Audience Migration® figures derived from the PPM panelists.
With Audience Migration®, the bright green bars indicate the listening or viewing levels for a specific time and date. The red bars represent audience that tuned out. In addition, you can see in-home and out-of-home listening levels. Examine the differences in audience preferences based on location, every minute of the broadcast day.
Media Monitors offers Audience Reaction®, Audience Migration®, In and Out of Home listening for all Nielsen Audio markets exclusively.
